How to create a Console screenshot for the support team?
For some issues, the support team may ask you to take a screenshot of the browser console, to help us investigate the problem. Below you will find guides for some of the most common browsers.
Google Chrome
You will need to open the developers console for this. You can open it in the top-right corner in the Chrome Menu by selecting More Tools > Developer Tools, or by using Shift + ⌘ + C (on macOS) or Shift + CTRL + C (on Windows and Linux), or alternatively, by a right-click of your mouse, where you will see an option Inspect.
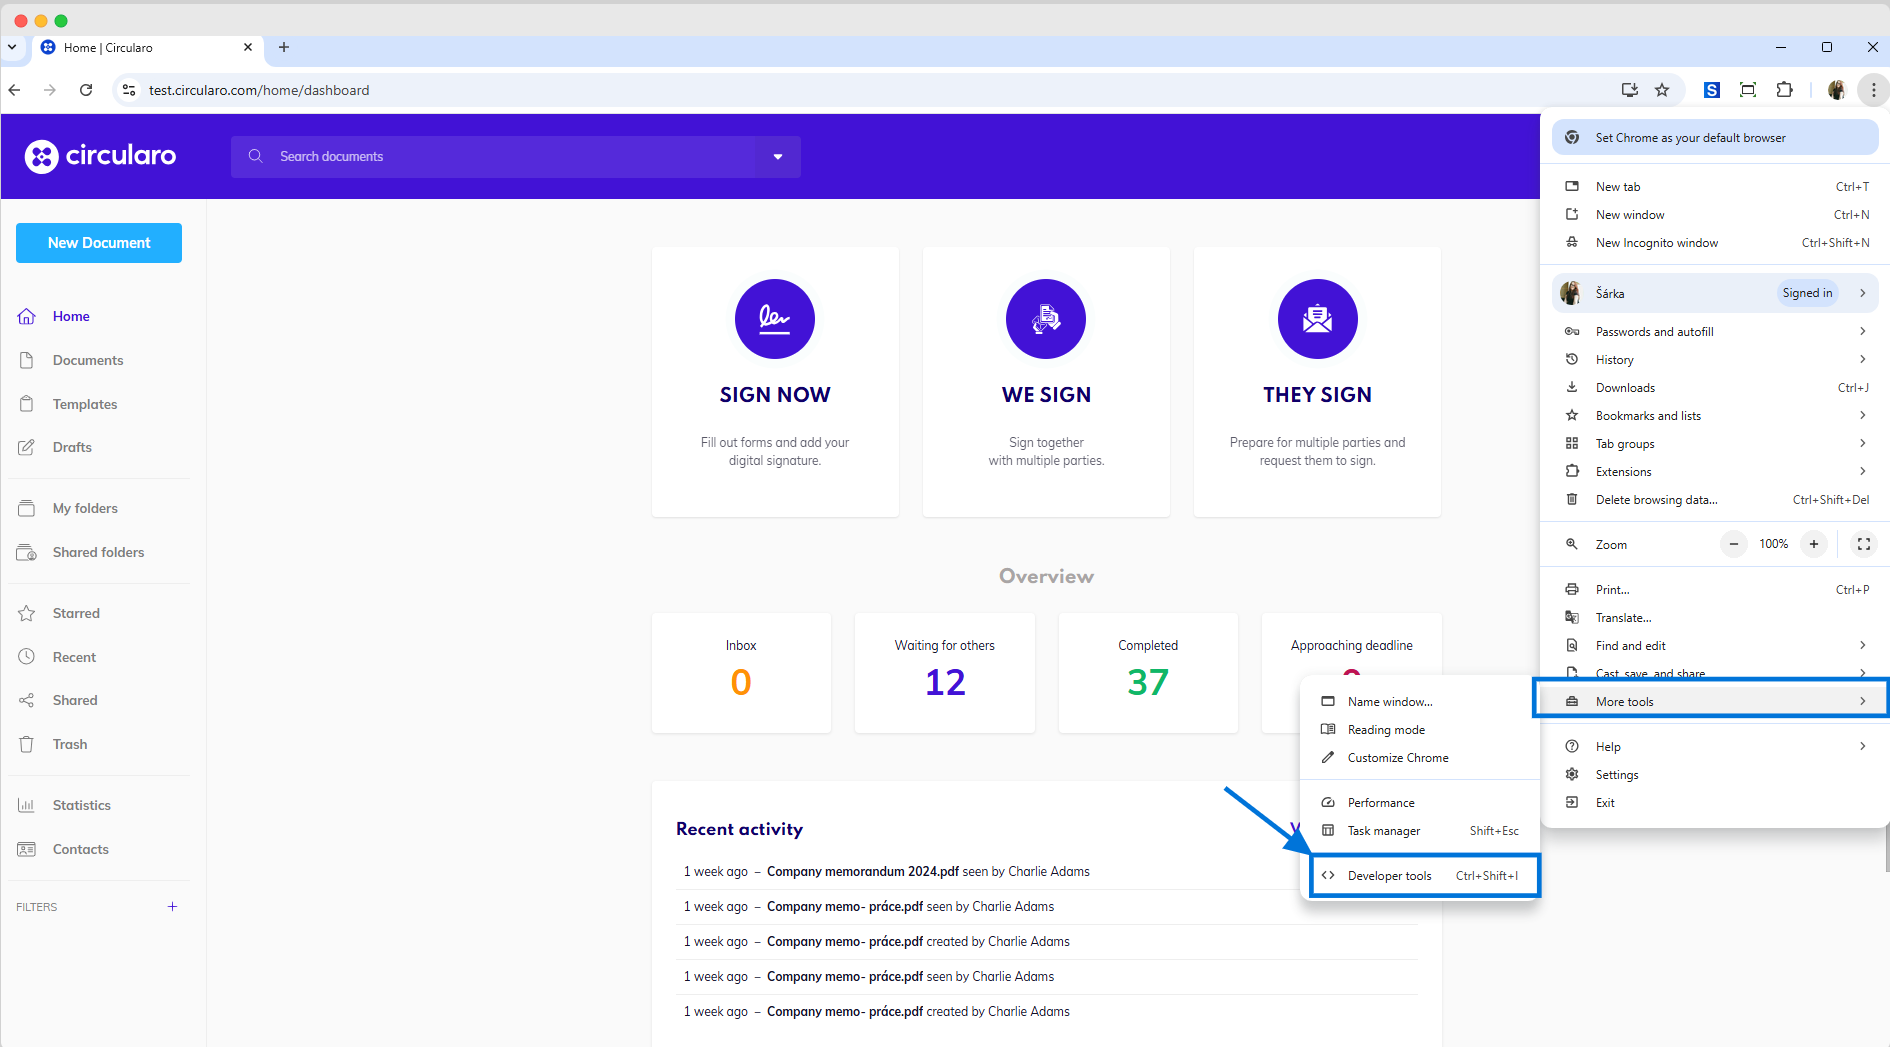
Chrome - developers tools
In the Developer Tools panel, click on the Console tab.
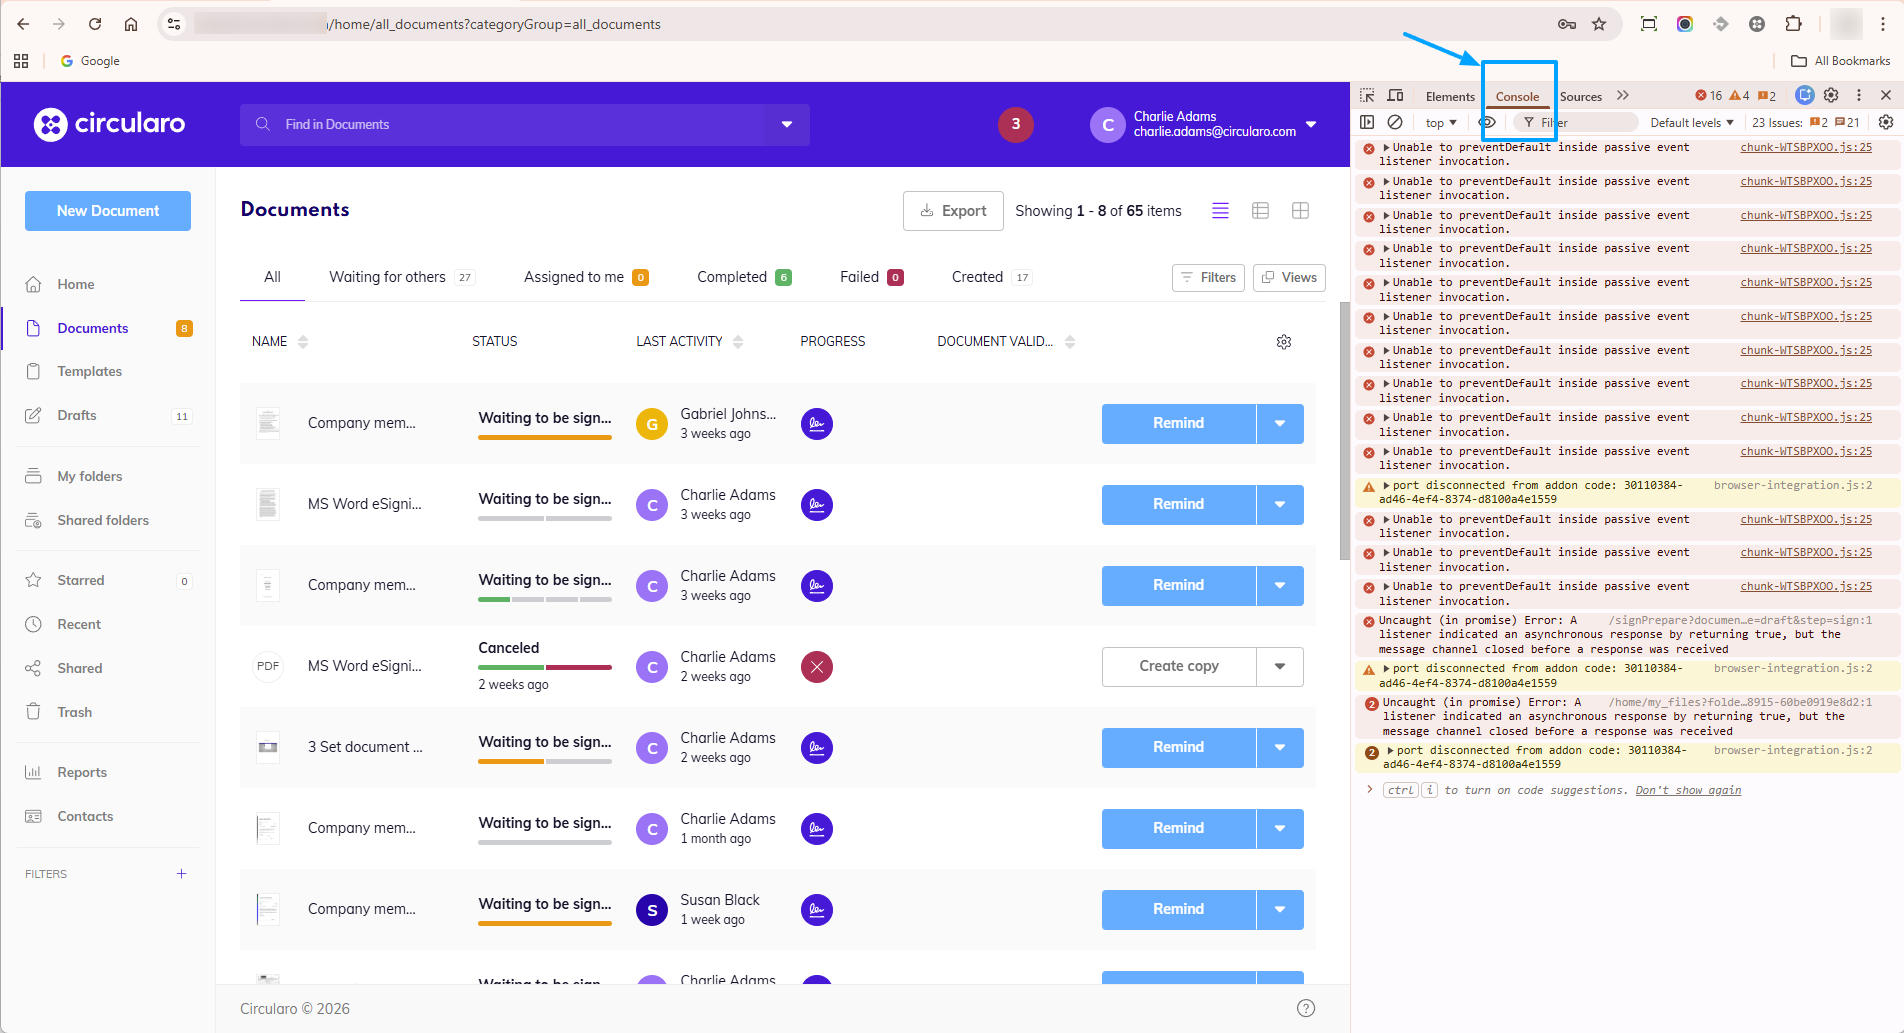
Chrome - Console tab
Refresh the page and reproduce the steps you took that resulted in the issue or error message.
Create a screenshot of the page - we recommend including everything on your screen, but please make sure the whole console tab is visible.
Microsoft Edge
You will need to open the developers console for this. You can open it in the top-right corner in the Edge Menu by selecting More Tools > Developer Tools, or by using Shift + ⌘ + C (on macOS) or Shift + CTRL + C (on Windows and Linux)
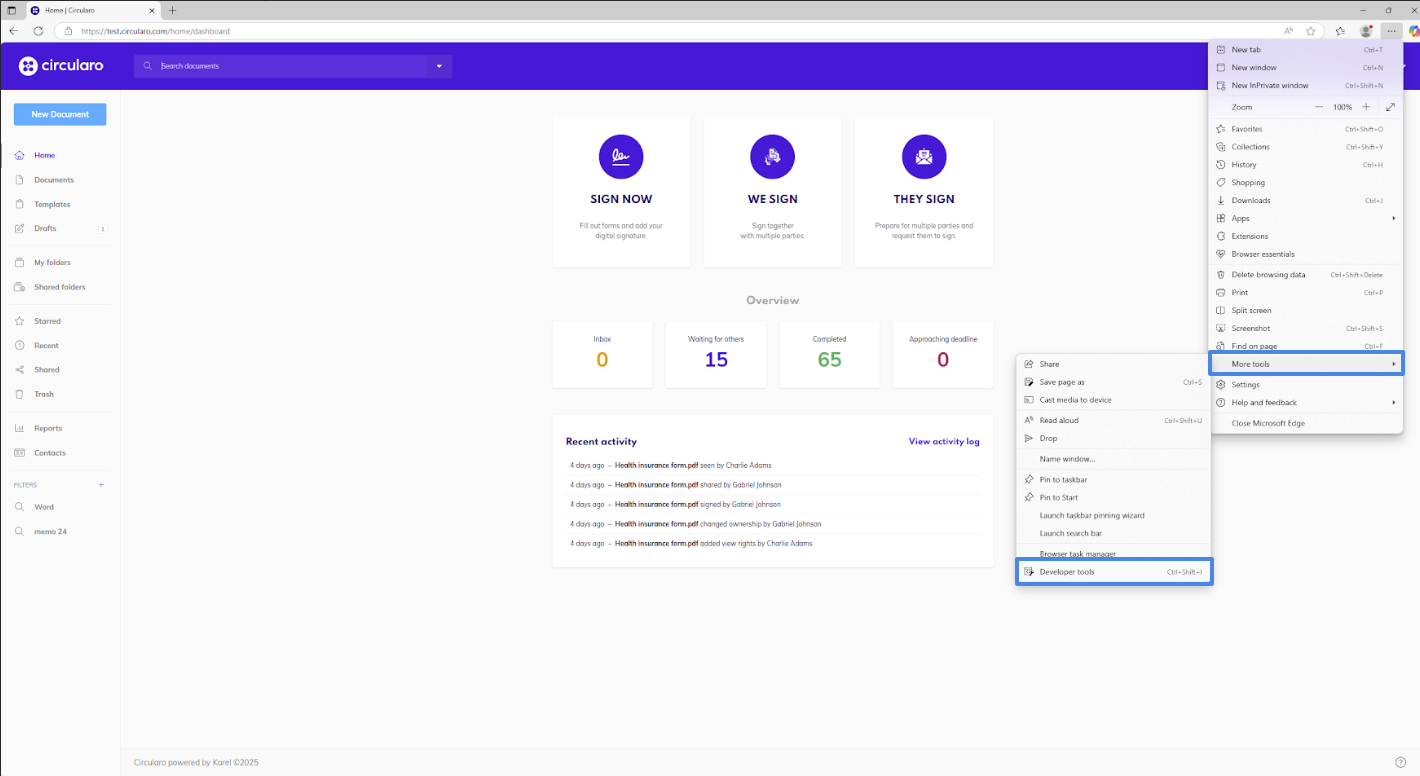
Edge - Developer tools
In the Developer Tools panel, click on the Console tab.
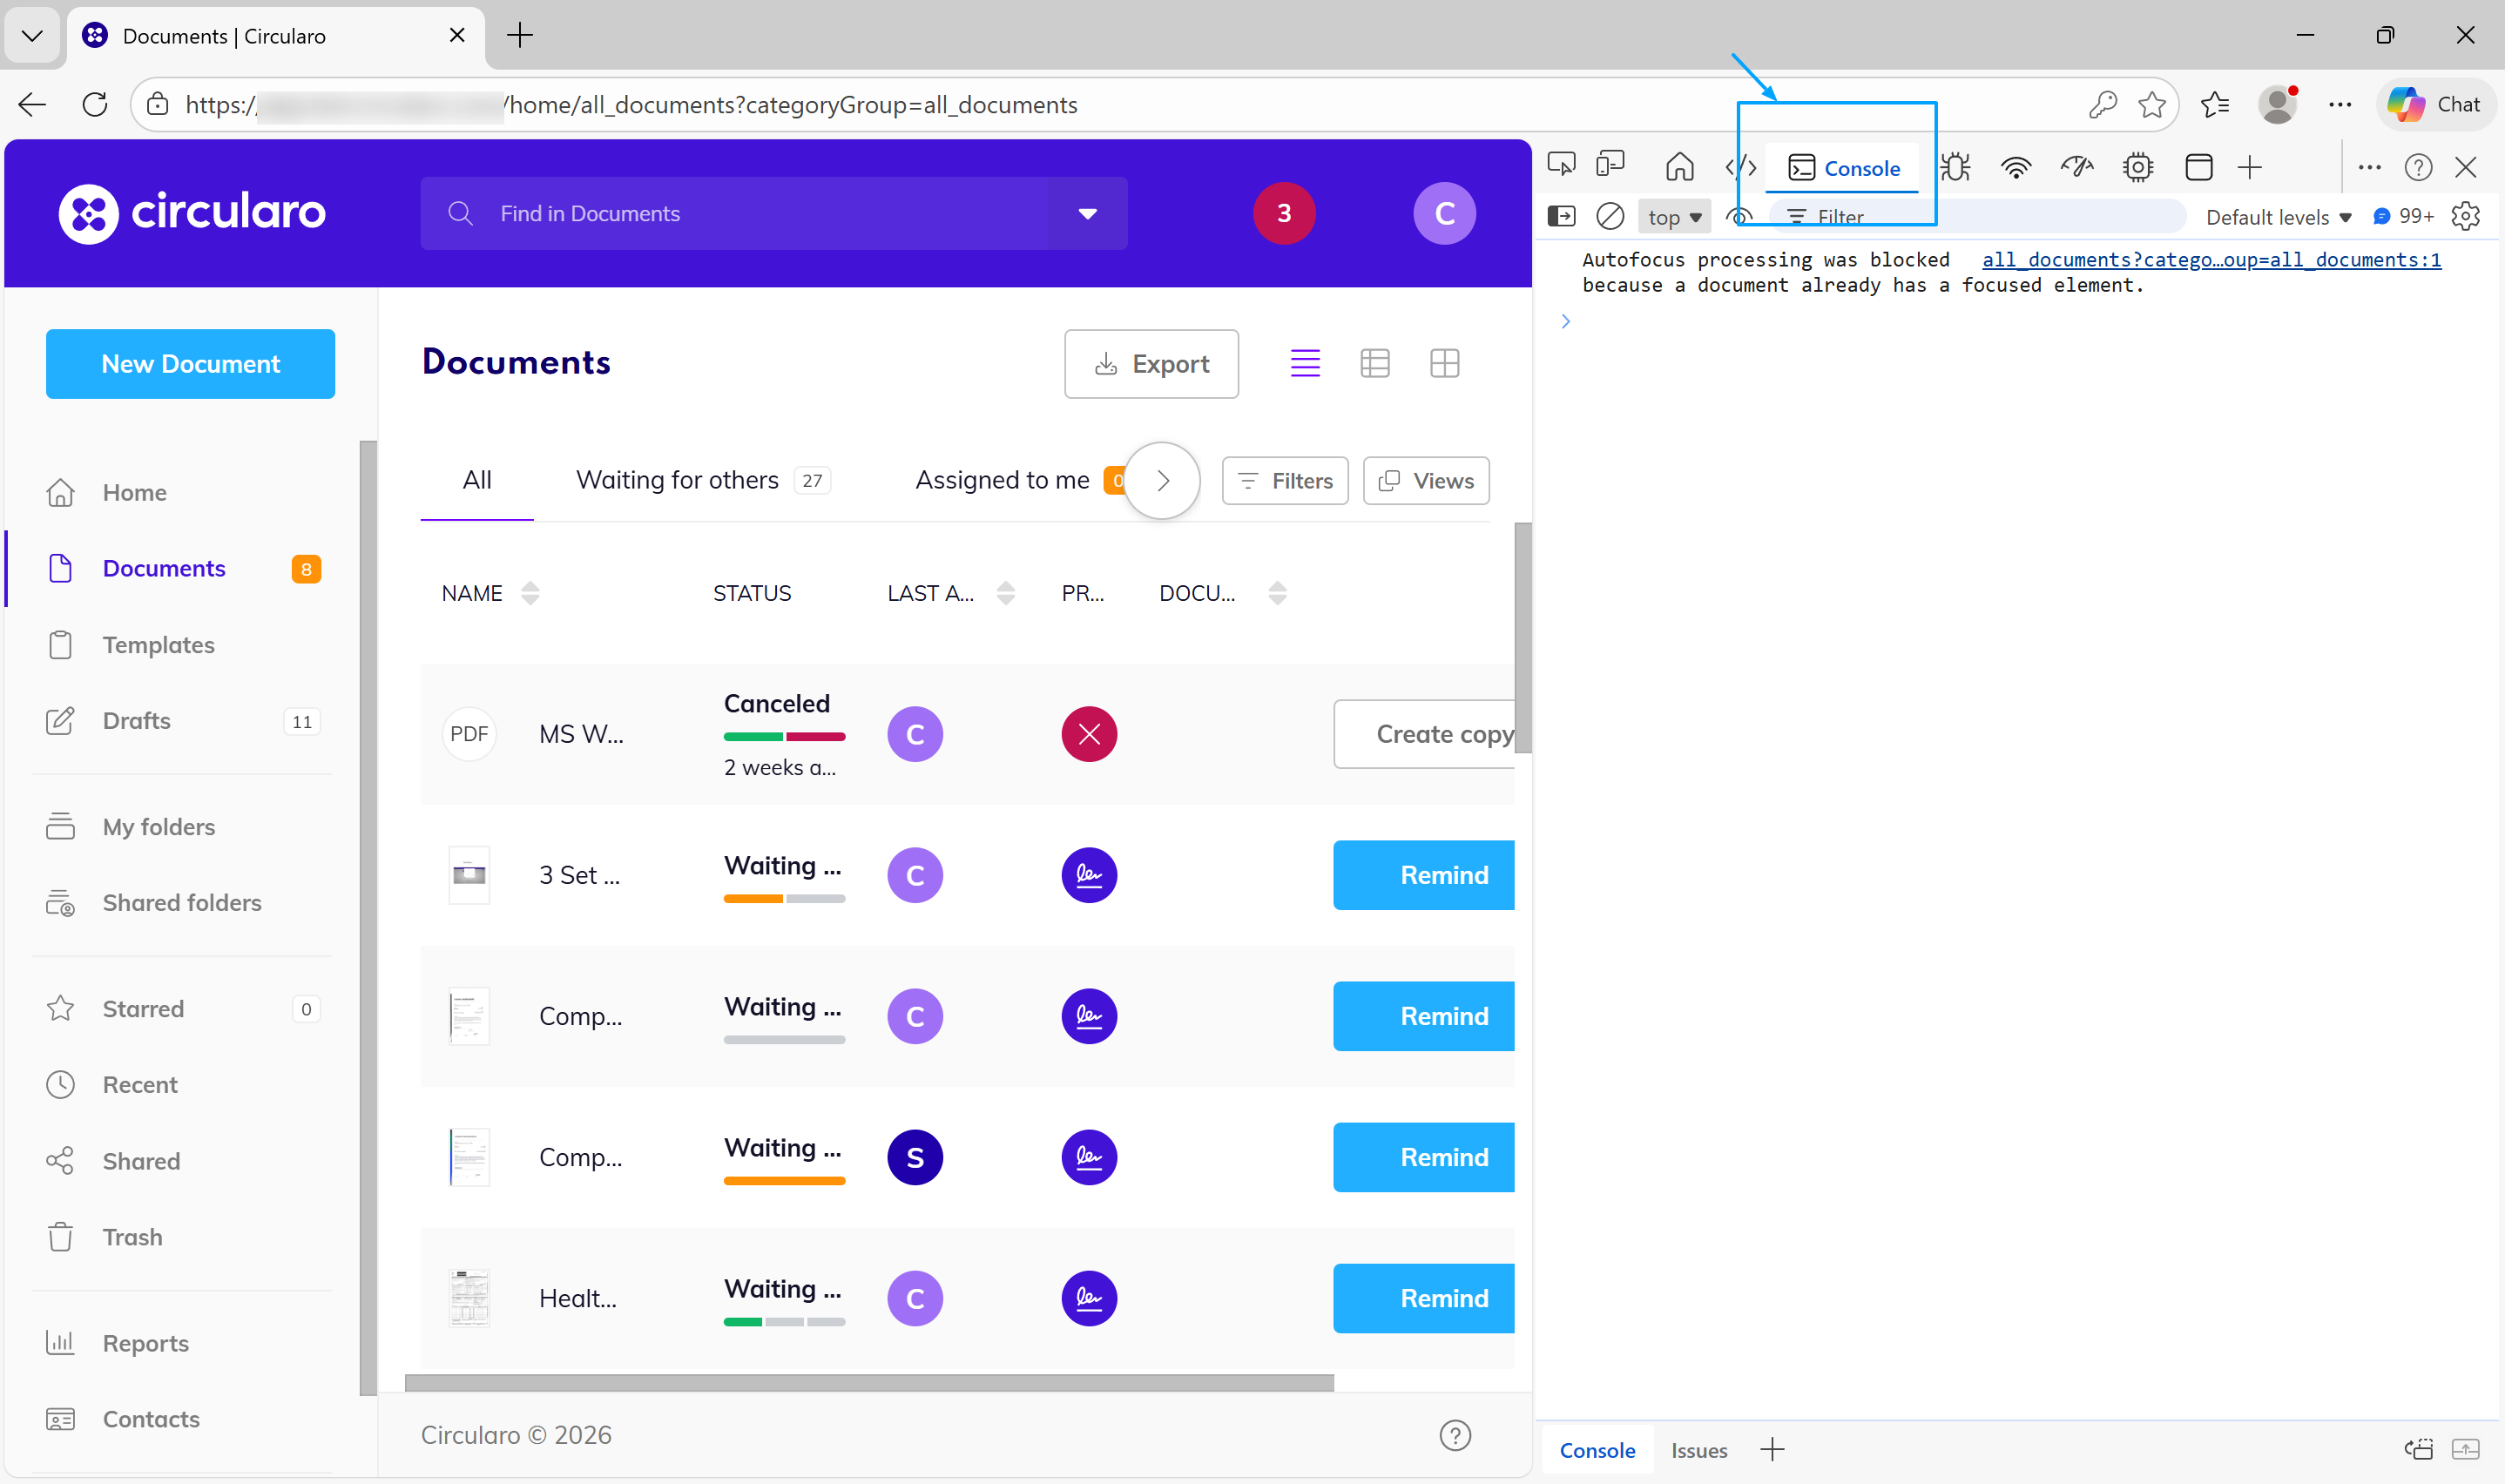
Edge - Console tab
Refresh the page and reproduce the steps you took that resulted in the issue or error message.
Create a screenshot of the page - we recommend including everything on your screen, but please make sure the whole console tab is visible.
Safari
You need to make sure the “Show Develop Menu” tab is visible, which you can do in Safari > Settings > Advanced tab.
Go to the Menu bar.
Click Develop.
Select Show/Connect Web Inspector.
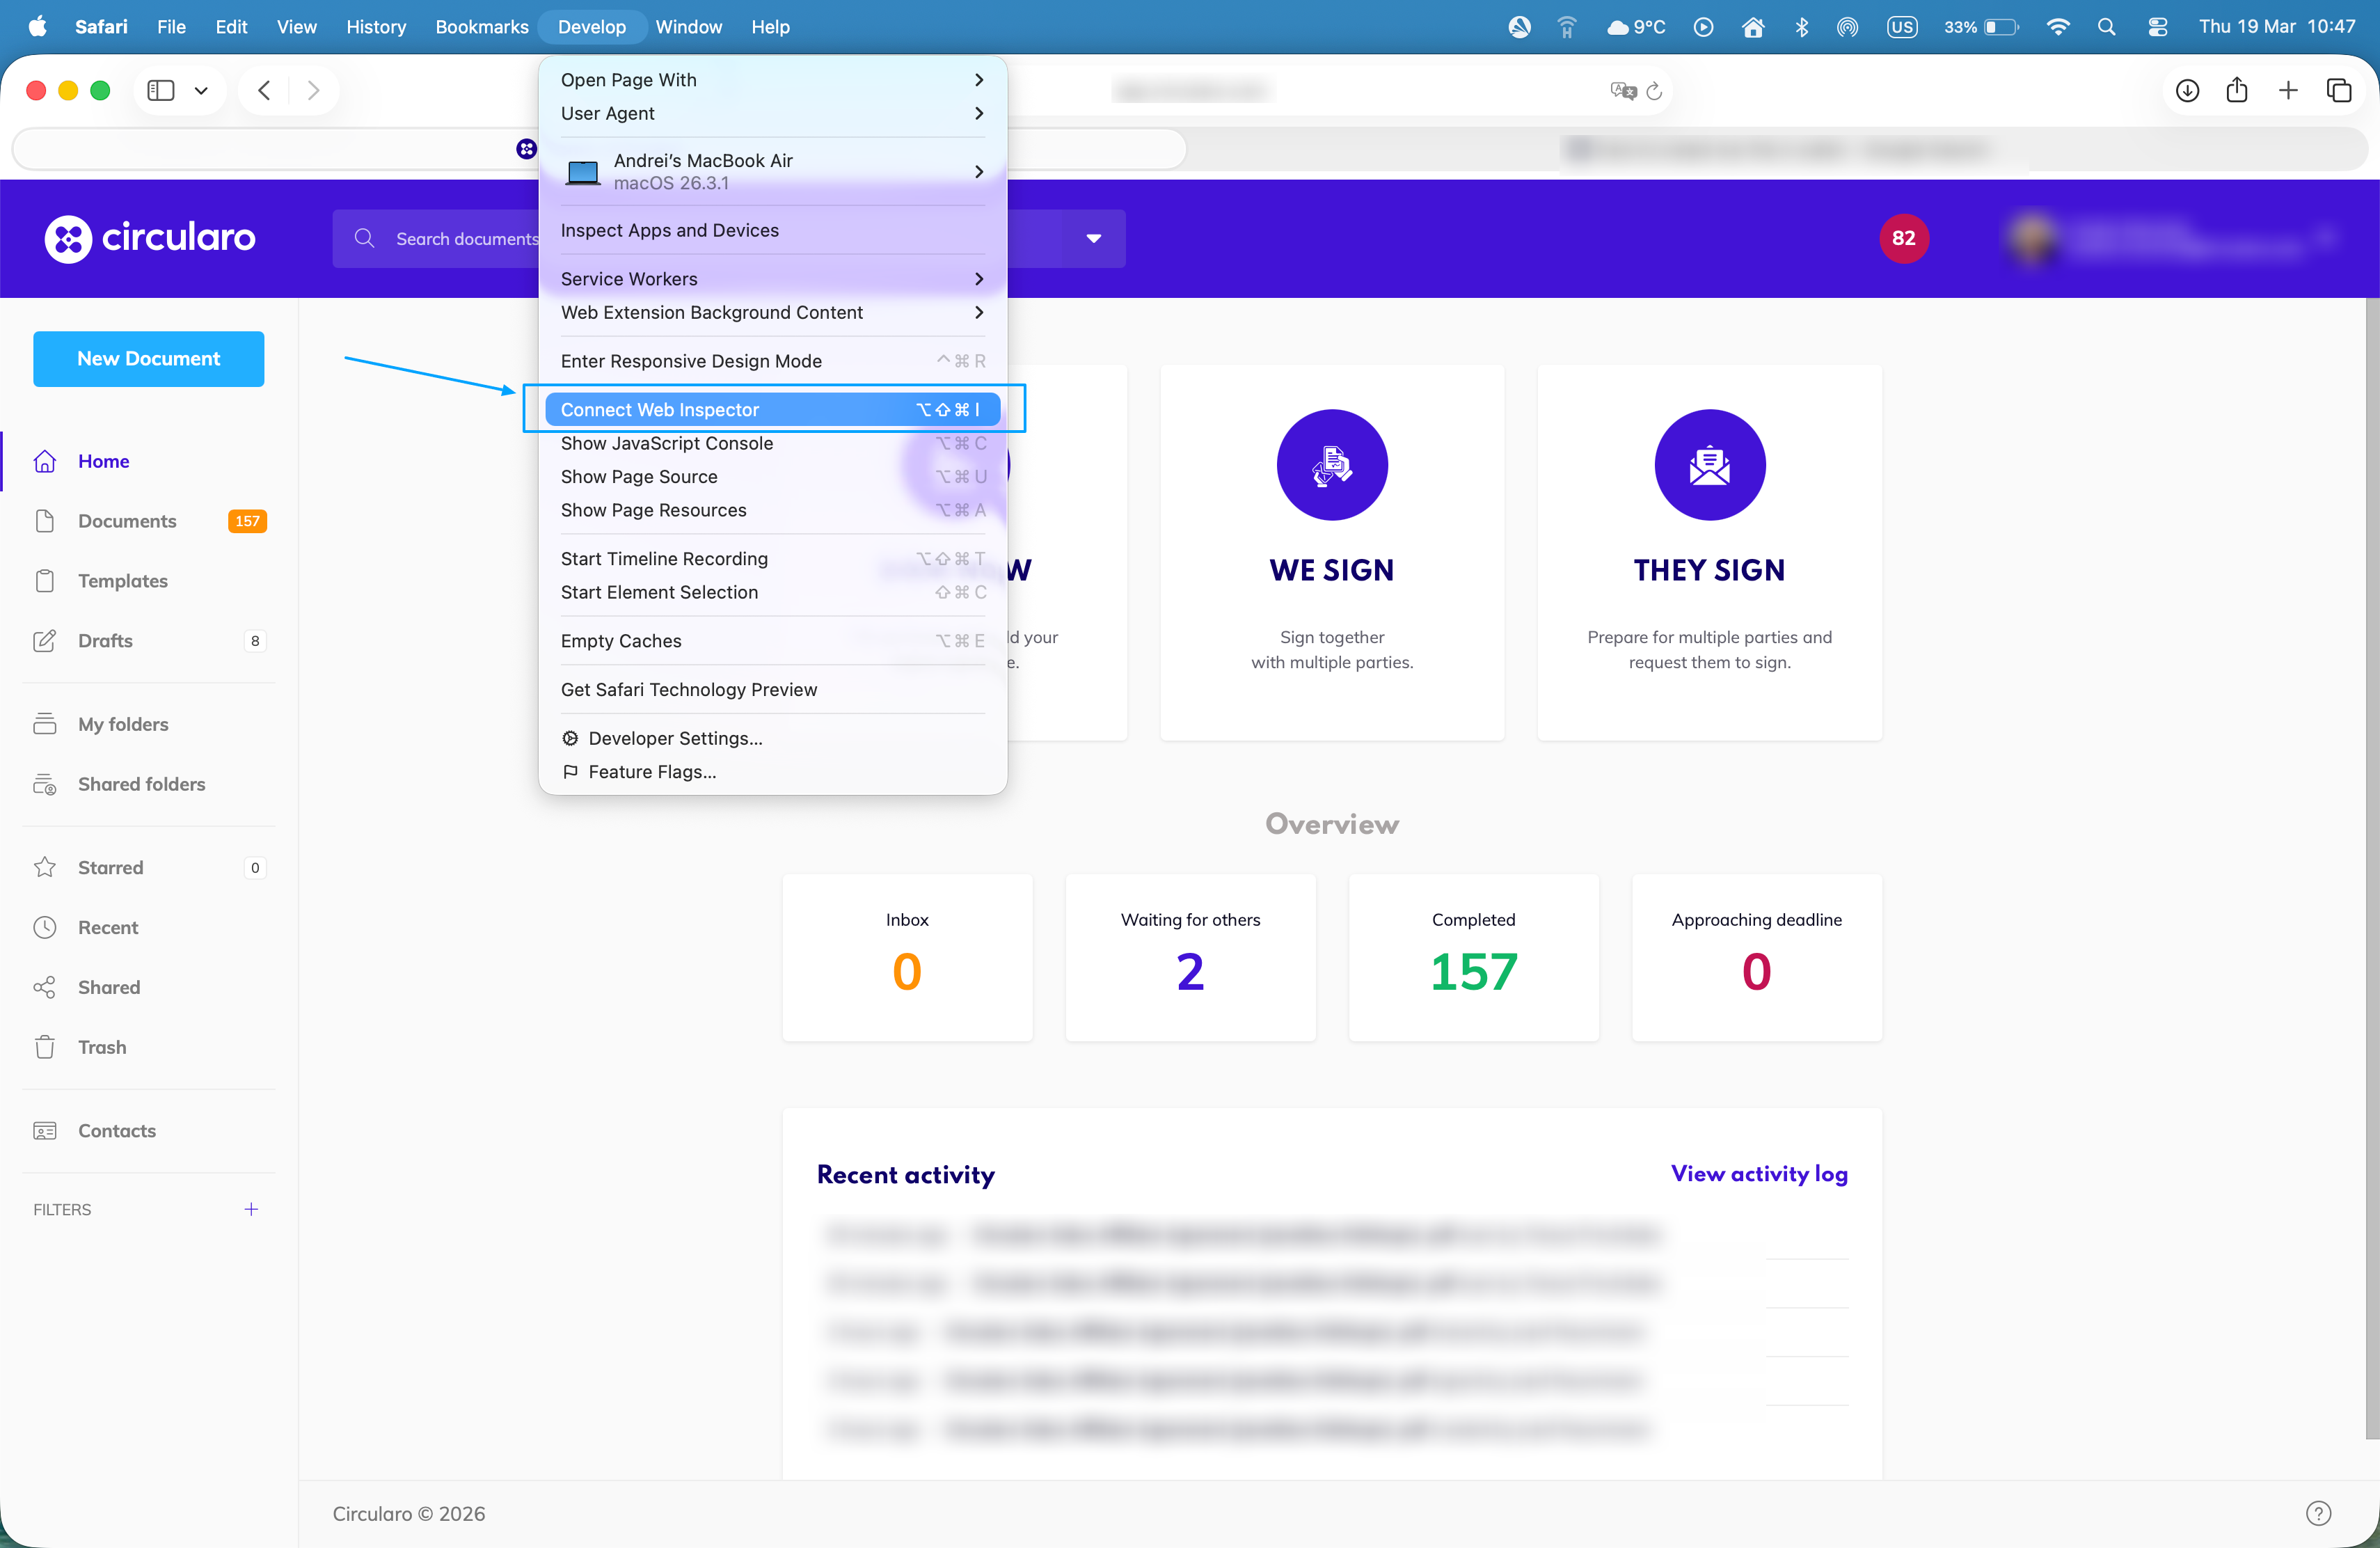
Safari - Inspector
Go to the Console tab.
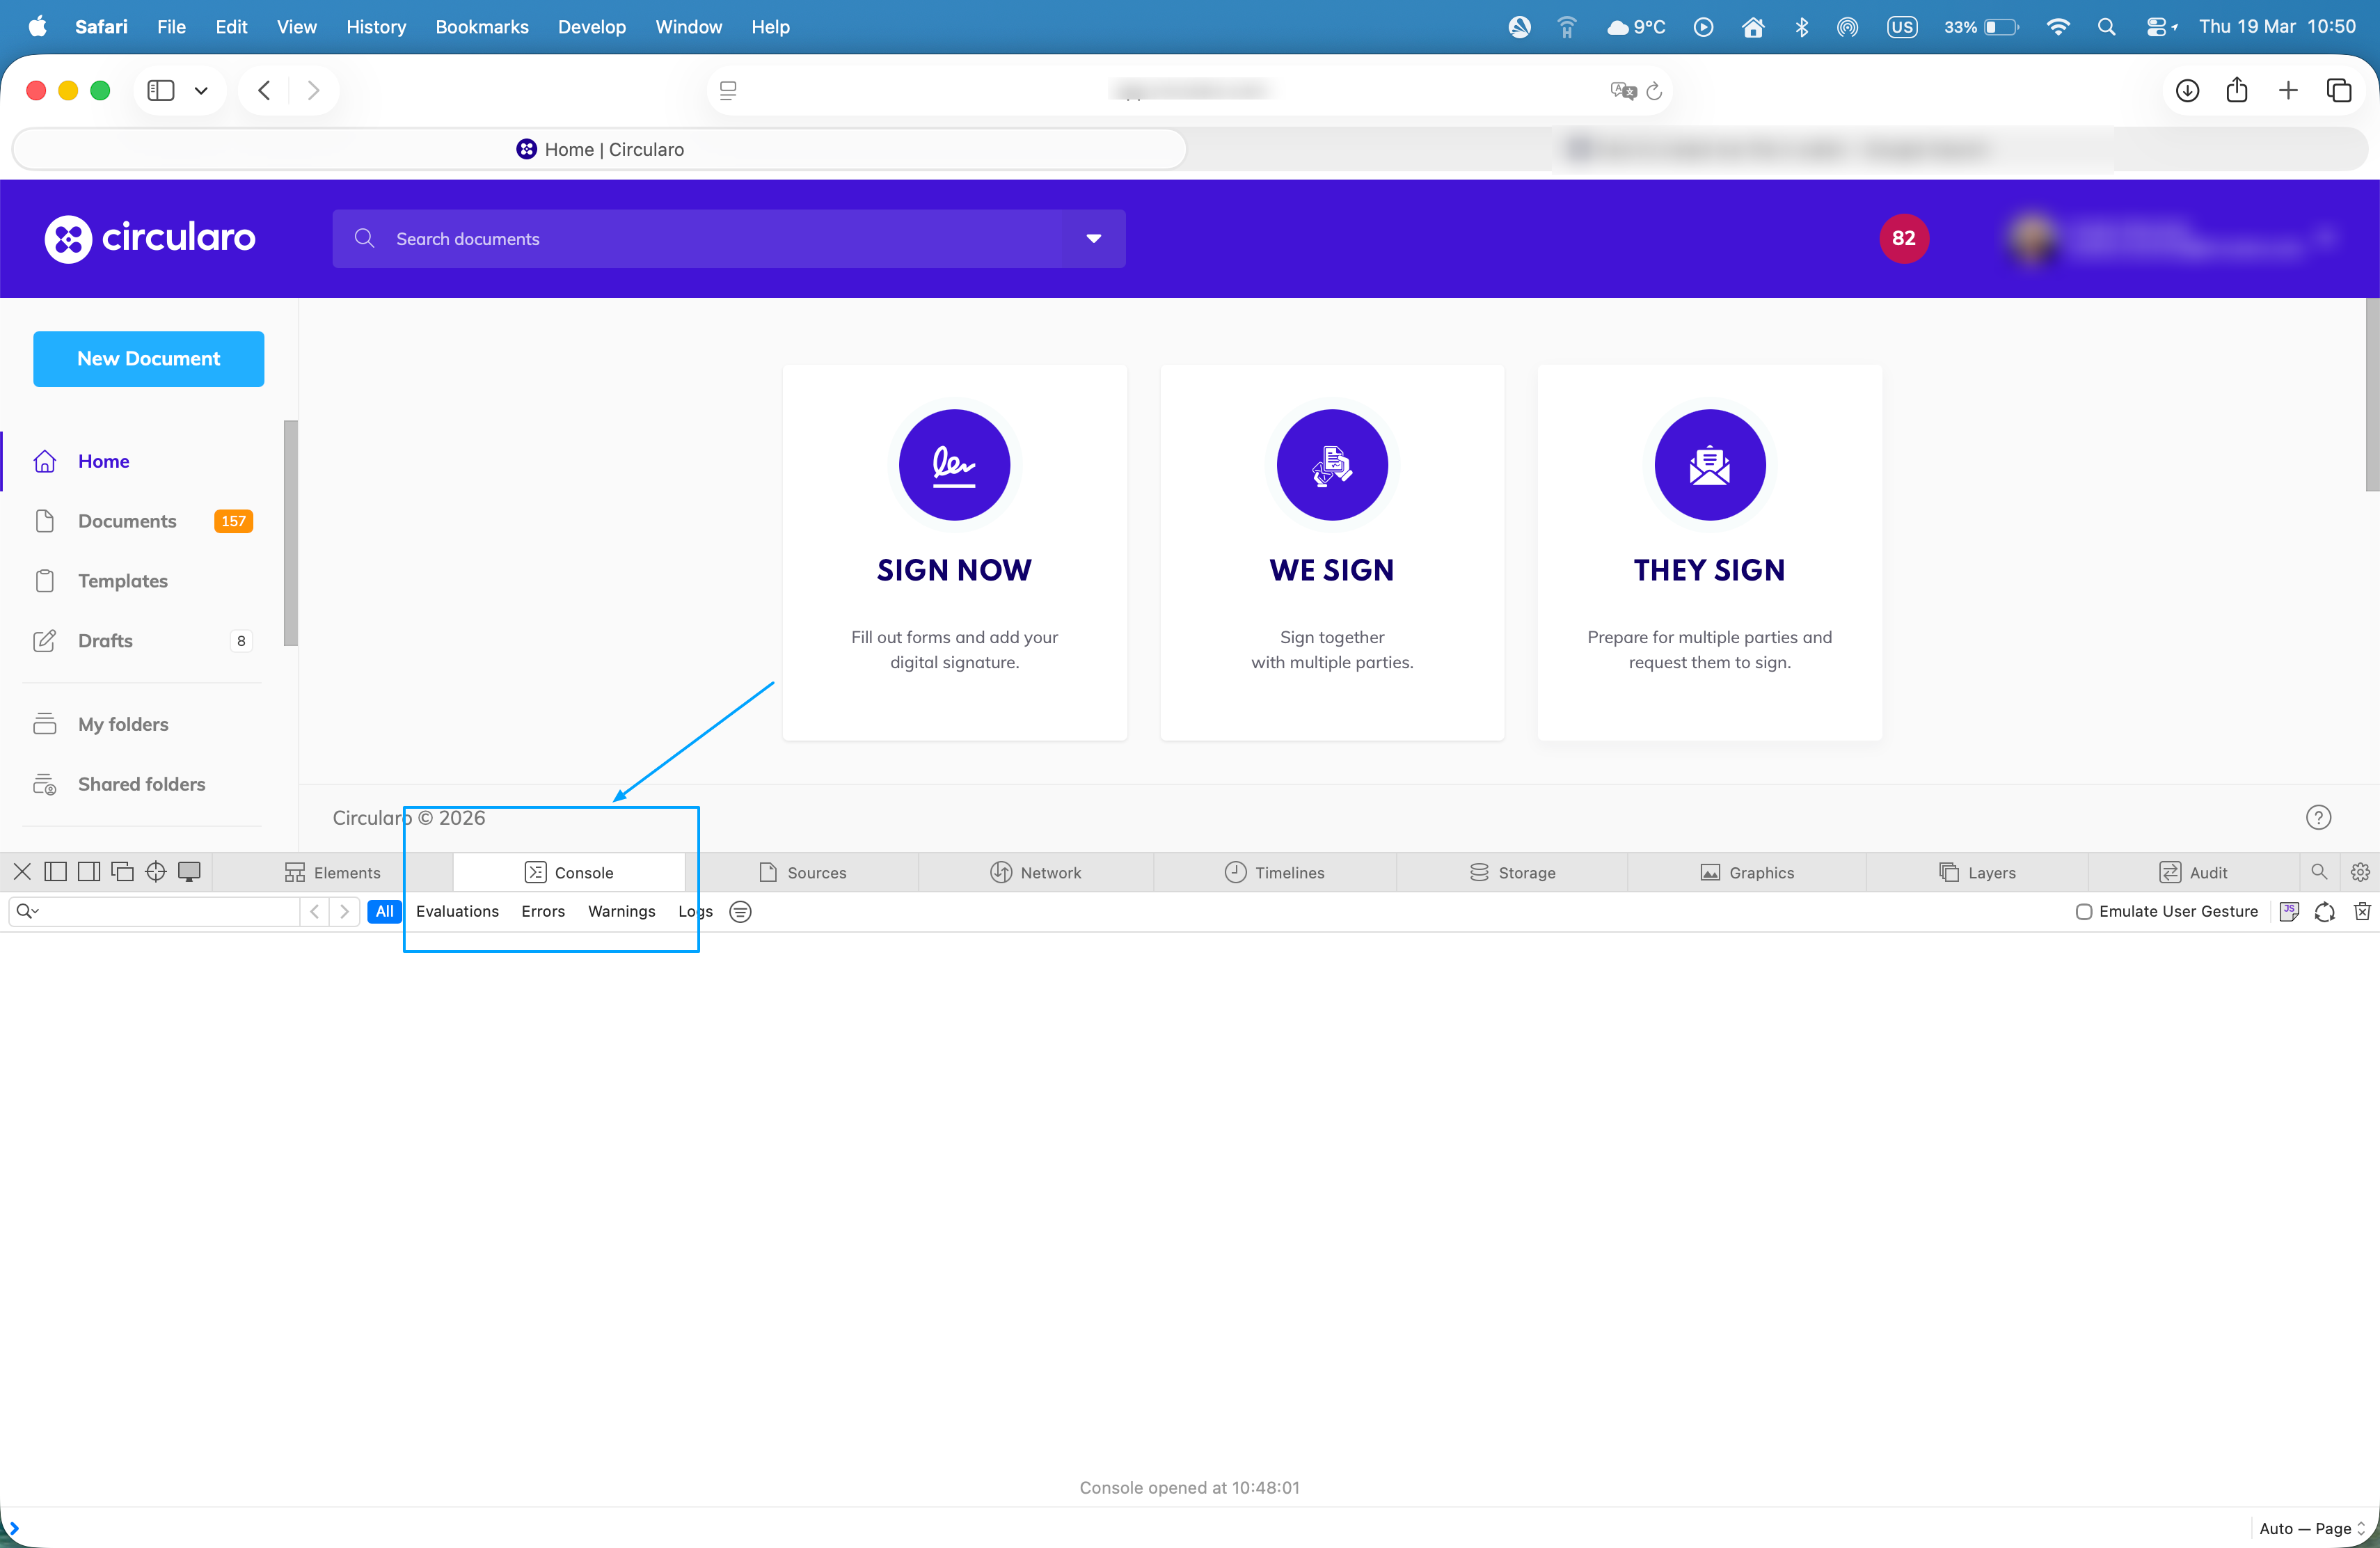
Safari - Console tab
Refresh the page and reproduce the steps you took that resulted in the issue or error message.
Create a screenshot of the page - we recommend including everything on your screen, but please make sure the whole console tab is visible.
Firefox
Go to the Menu in the top-right corner of the browser.
Select More Tools > Web Developer Tools, or access it by using Option + ⌘ + E (on macOS) or Shift + CTRL + C (on Windows/Linux). Alternatively, you can right-click your mouse and choose the Inspect option.
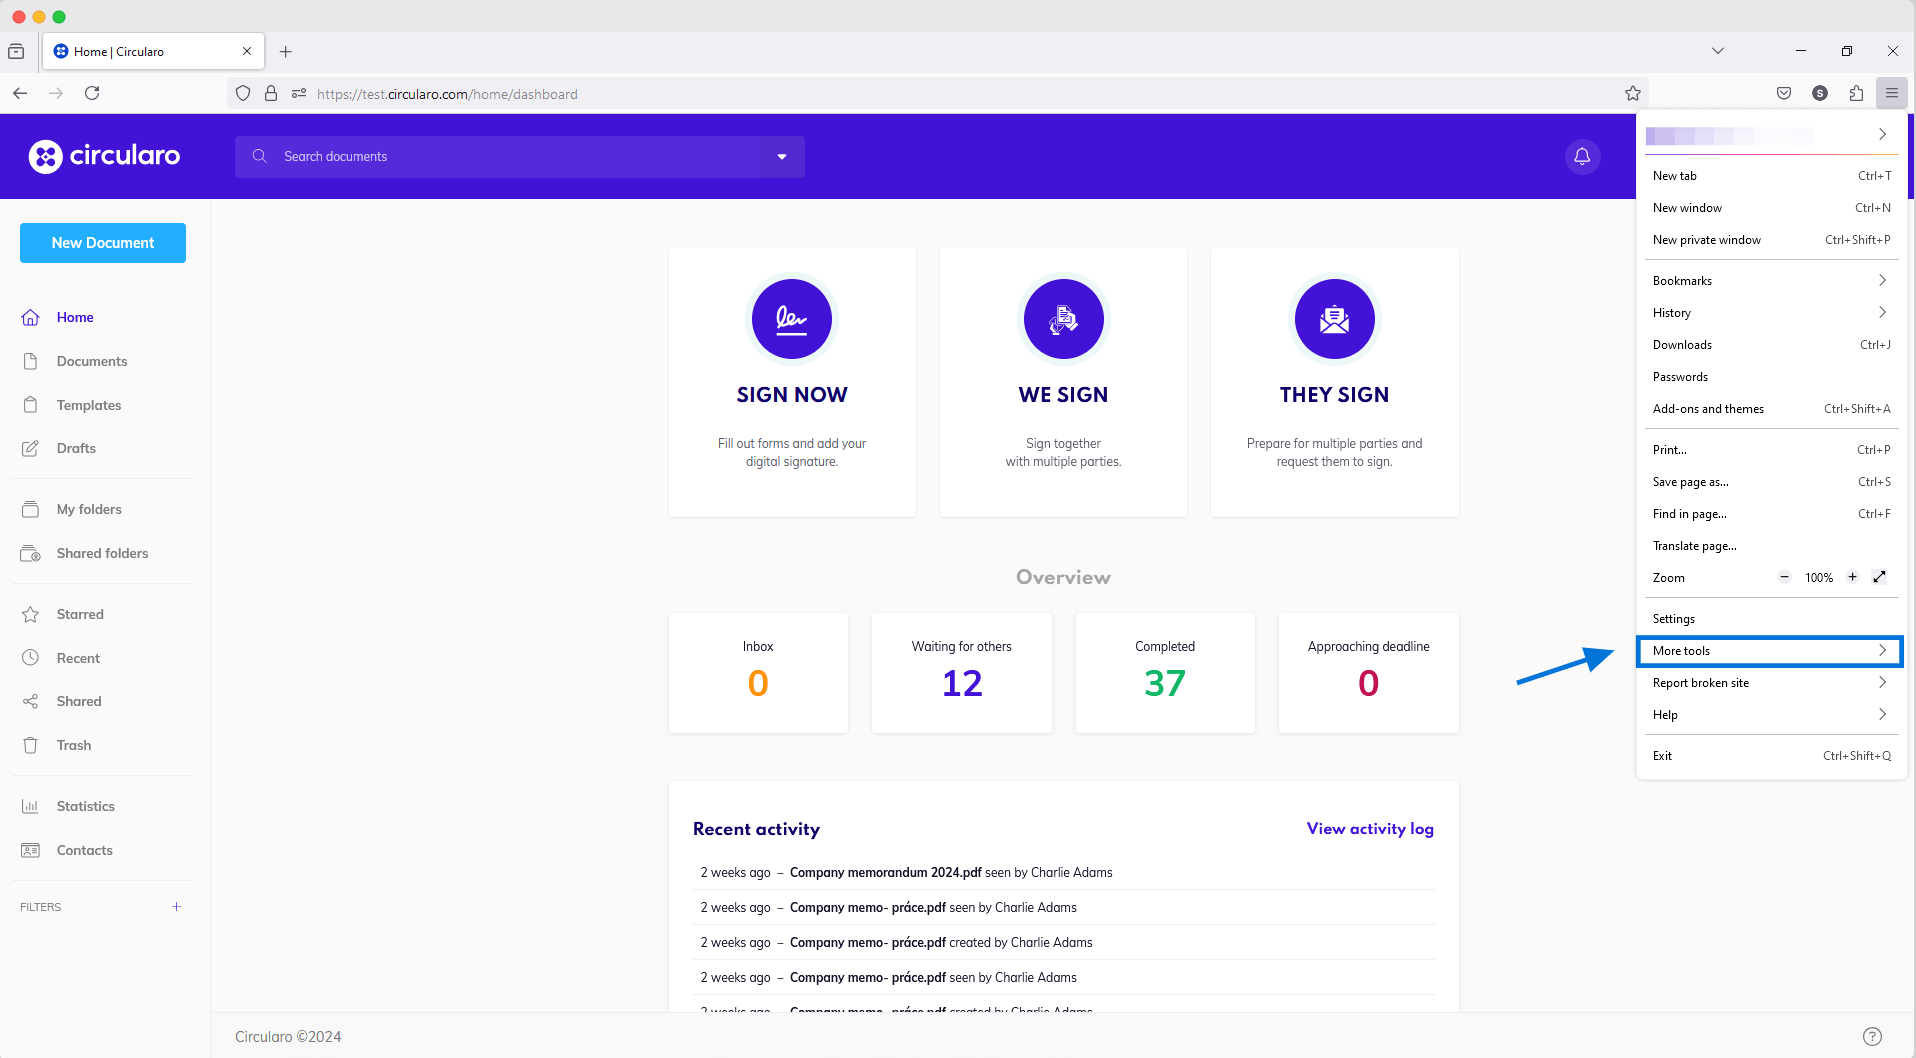
Firefox - More tools
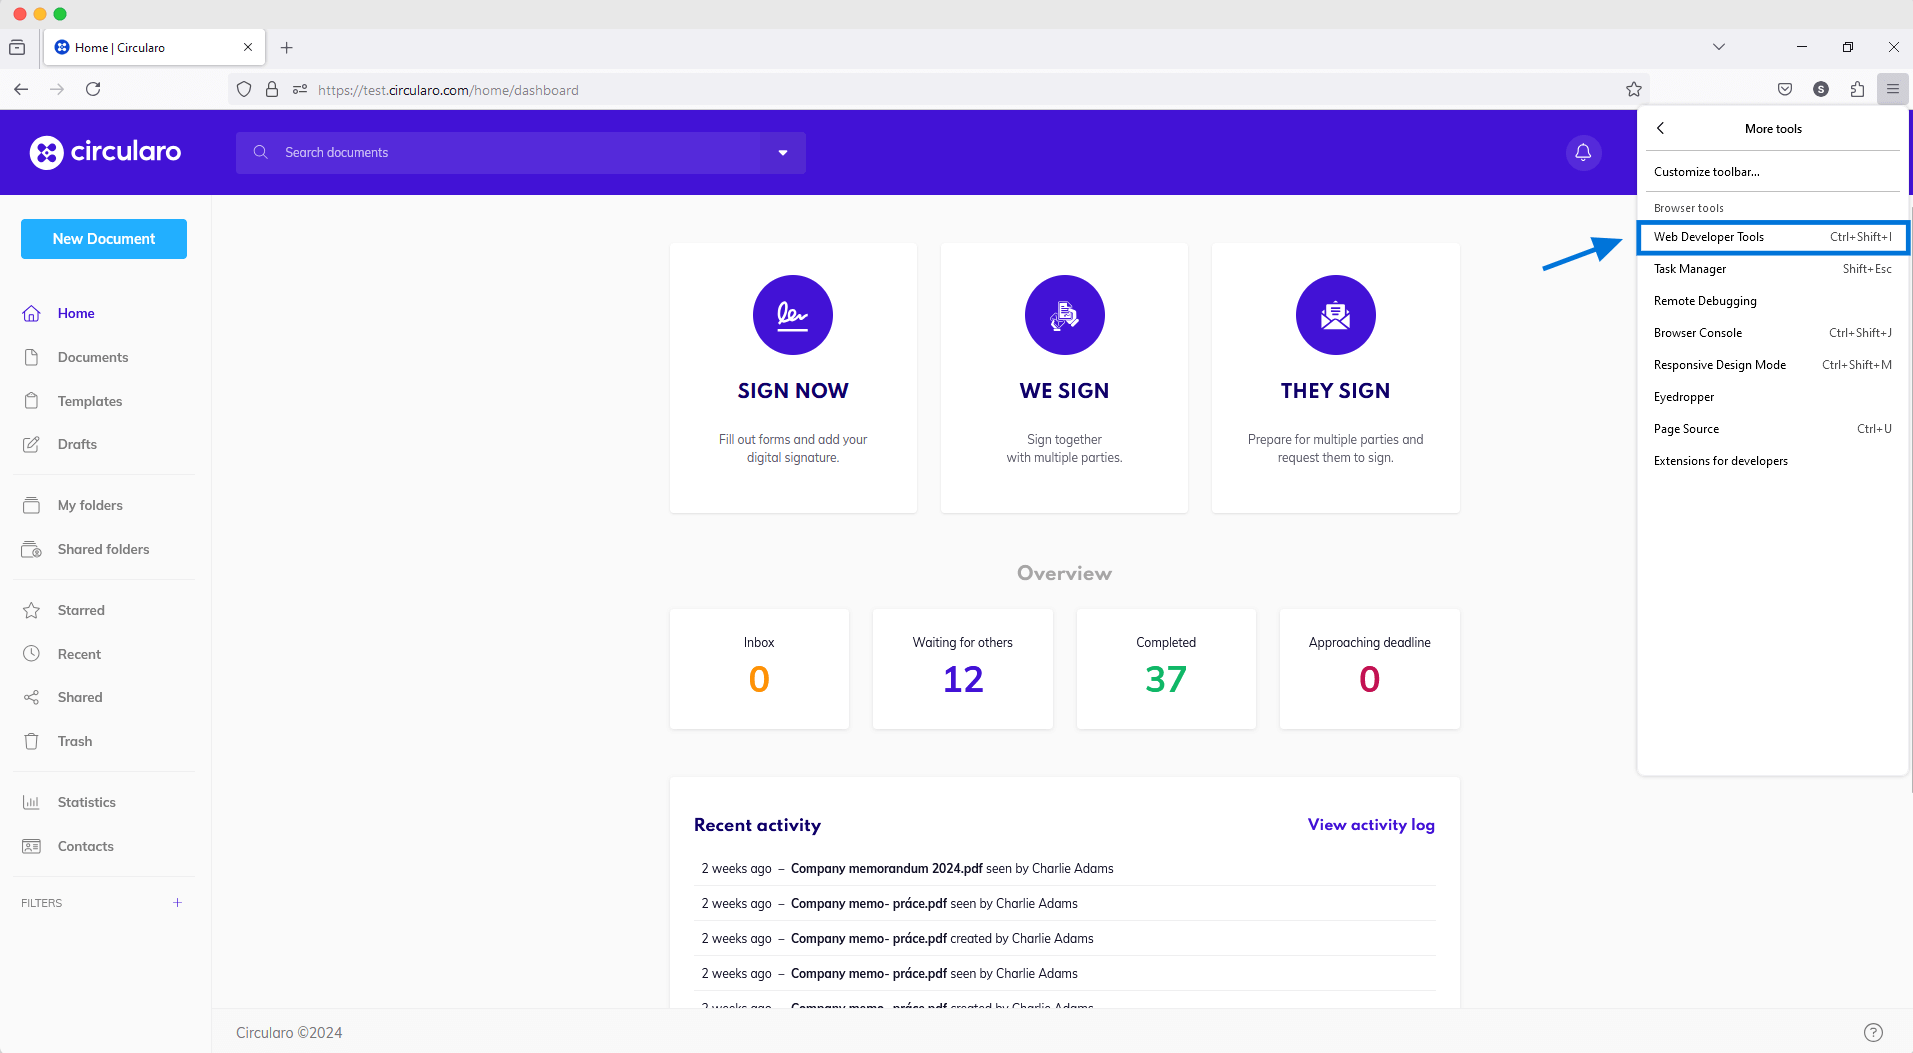
Firefox - Web developer tools
Go to the Console tab.
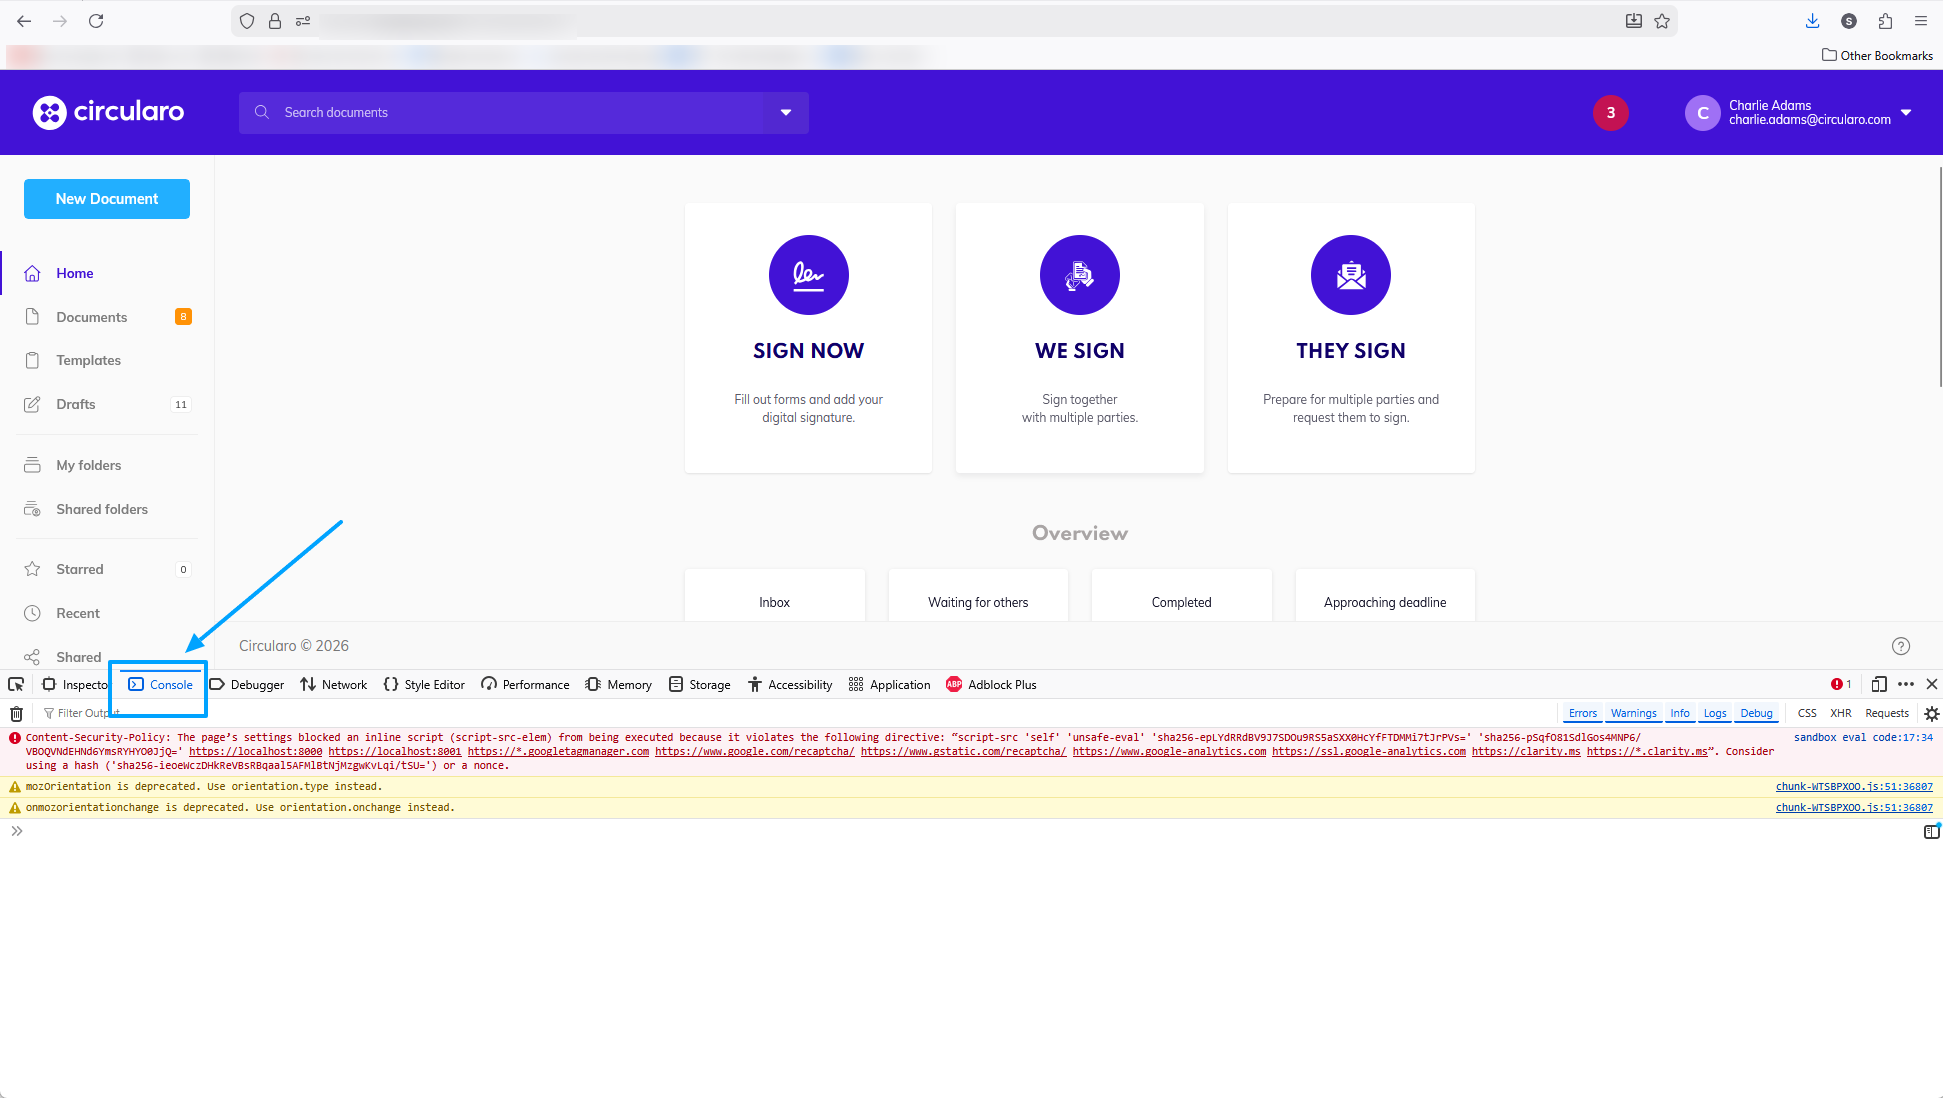
Firefox - Console tab
Refresh the page and reproduce the steps you took that resulted in the issue or error message.
Create a screenshot of the page - we recommend including everything on your screen, but please make sure the whole console tab is visible.